Matlab: Fehlerfunktionen (exponentiell)
Ergänzung zu Fehlergeraden mit Matlab
Exponentielles Fitting
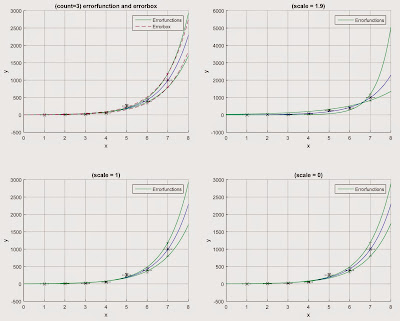
(English) In diesem Post wird noch die Matlabfunktion für Plots mit halblogarithmischer Skalabzw. mit einem exponentiellen Verhalten der Form "b*(exp(a*x)". Die Funktion ist wie die Funtion "Errorline" aufgebaut. Der einzige Unterschied ist, dass diese Funktion ein Eingabewert mehr benötigt.function [smax,smin,rmax,rmin] = errexpfunc(x,y,xerr,yerr, count,scale)
Hierbei gibt scale die Stelle des Schnittpunktes der beiden Fehlerfunktionen in Abhängigkeit von den x-Werten an. Für "scale = 1" schneiden sich die beiden Fehlerexponentialfunktionen in der Mitte und für "scale = 0" am ersten x-Wert und für "scale = 2" am letzten Messwert.
Quellcode:
function [smax,smin,rmax,rmin] = errexpfunc(x,y,xerr,yerr, count,scale)%This is a function to plot a maximal and minimal errorline with given
%errors 'xerr' and 'yerr'. It also can create the box around the mesured
%values to see in which area the errorlines are plotted.
%For count 1 it plots just the errorline. For count 2 it plots the box and
%count 3 it plots both. Scale ist the value, where the intersection of the
%two functions are. It just exsists in the area [0;2).
l=numel(x);
xmid=x(1)+(x(l)-x(1))/2*scale
xerr=0;
if(xerr==0)
xerr = zeros([l,1])
end
ymax=y+yerr
ymin=y-yerr
fitmax=fit(x,ymax,@(a,b,x) b*exp(a*x));
fitmin=fit(x,ymin,@(a,b,x) b*exp(a*x));
fitVal=fit(x,y, @(a,b,x) b*exp(a*x));
%Fit the maximal and the minimal errorlines through the mesured values with
%their deviations.
a=coeffvalues(fitmax);
b=coeffvalues(fitmin);
c=coeffvalues(fitVal);
amax=a(1);
amin=b(1);
bmax=a(2);
bmin=b(2);
afit=c(1);
bfit=c(2);
%Declare the 4 corners of the box
xlu=x(1)-xerr(1);
xld=x(1)-xerr(1);
xru=x(l)+xerr(1);
xrd=x(l)+xerr(1);
ylu=exp(amax*xlu)*bmax;
yrd=exp(amin*xrd)*bmin;
ymid=exp(afit*xmid)*bfit;
yru=exp(amax*xru)*bmax;
yld=exp(amin*xld)*bmin;
ymid=exp(afit*xmid)*bfit;
xcrnl=[xld xlu];
xcrnr=[xrd xru];
ycrnl=[yld ylu];
ycrnr=[yrd yru];
expmaxx=[xlu xmid xrd];
expmaxy=[ylu ymid yrd];
expminx=[xld xmid xru];
expminy=[yld ymid yru];
fitmax1=fit(expmaxx',expmaxy',@(a,b,x) b*exp(a*x));
fitmin1=fit(expminx',expminy',@(a,b,x) b*exp(a*x));
a=coeffvalues(fitmax1);
b=coeffvalues(fitmin1);
smax=a(1);
smin=b(1);
rmax=a(2);
rmin=b(2);
hold on;
if(count==1)
h1=plot(fitmax1);
set(h1,'Color',[0.0 0.7 0.3])
h2=plot(fitmin1)
set(h2,'Color',[0.0 0.7 0.3])
legend([h1],'Errorfunctions');
end
if(count==2)
h3=plot(fitmax,'--');
set(h3,'Color',[0.8 0 0.4]);
h4=plot(fitmin,'--');
set(h4,'Color',[0.8 0 0.4]);
plot(xcrnl',ycrnl','--','Color',[0.8 0 0.4]);
plot(xcrnr',ycrnr','--','Color',[0.8 0 0.4]);
legend([h4],'Errorbox');
end
if (count==3)
h1=plot(fitmax1);
set(h1,'Color',[0.0 0.7 0.3])
h2=plot(fitmin1)
set(h2,'Color',[0.0 0.7 0.3])
h3=plot(fitmax,'--');
set(h3,'Color',[0.8 0 0.4]);
h4=plot(fitmin,'--');
set(h4,'Color',[0.8 0 0.4]);
plot(xcrnl',ycrnl','--','Color',[0.8 0 0.4]);
plot(xcrnr',ycrnr','--','Color',[0.8 0 0.4]);
plot(xcrnl',ycrnl','--','Color',[0.8 0 0.4]);
plot(xcrnr',ycrnr','--','Color',[0.8 0 0.4]);
legend([h1 h4],'Errorfunctions','Errorbox');
end
end


Kommentare
Kommentar veröffentlichen