Matlab: Punkte und Vektoren in 3D-Plots
Punkte und Vektoren in 3D-Plots
(English) Diese Matlabfunktion ist für das im vorherigen Post dargestellte 3D-Gitter. Dabei kann mit folgender Funktion ein Vektor bzw. ein Punkt im 3D-Plot erstellt werden.function punkt3D(x1,y1,z1,x2,y2,z2,sign,name,color,dx,dy,dz,true)
Du benötigst hierfür diese 2 Funktionen:
Dabei gibt "startVec" den Startpunkt des Vektors und "stopVec" den Endpunkt an. Es können verschiedene optionale Parameter gewählt werden:
'Marker' ... kann entweder 'arrow' sein damit ein Kegel gezeigt wird oder als Default ein Punkt.
'Marker' ... kann entweder 'arrow' sein damit ein Kegel gezeigt wird oder als Default ein Punkt.
'Color' ... gibt die Farbe in RGB des Vektors an.
'LineWidth' ... bestimmt die Dicke des Vektors.
'Label' ... gibt den String an, wie der Vektor/Punkt benannt werden soll.
'Deviation' ... gibt den Abweichungsvektor zu dem Punkt an damit das Label nicht auf dem Punkt ist.
'PlotProjction' ... ermöglicht die Darstellung der Projektion des Vektors.
Hier der Quellcode:
figure;hold on;axis off;
grid3D([0,0,0], [1,1,1], 'Amount', [4,4,4], 'Axes', gca, 'MinorGrid','Arrow','AxTicks',[{['']},{['']},{['']}],...
'AxLabels',["";"";""]);
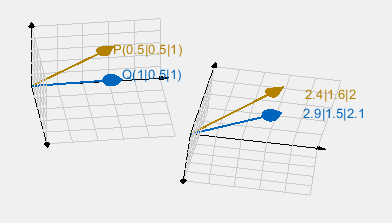
P = [0.5,0.5,1];
Q = [1,0.5,1];
point3D([0,0,0],P,'Marker','arrow','Label','P(0.5|0.5|1)','Color',[0.7 0.5 0]);
point3D([0,0,0],Q,'Marker','arrow','Label','Q(1|0.5|1)','Color',[0.0 0.4 0.74],'Deviation',[0,0,0.1]);
gridStart = [2,1,1];gridEnd = [3,2,2];
arg = grid3D(gridStart, gridEnd, 'Amount', [4,4,4], 'Axes', gca, 'MinorGrid','Arrow','AxTicks',[{['']},{['']},{['']}],...
'AxLabels',["";"";""],'Rotate',[10, 10, 10]);
rotateMat = arg;
newP = gridStart+[rotateMat*P']';
newQ = gridStart+[rotateMat*Q']';
s = num2str(round(newP,1));
while contains(s, ' ')
s = strrep(s, ' ', ' ');
end
PLabel = replace(s,' ','|');
s = num2str(round(newQ,1));
while contains(s, ' ')
s = strrep(s, ' ', ' ');
end
QLabel = replace(s,' ','|');
point3D(gridStart,newP,'Marker','arrow','Label',PLabel,'Color',[0.7 0.5 0]);
point3D(gridStart,newQ,'Marker','arrow','Label',QLabel,'Color',[0.0 0.4 0.74],'Deviation',[0,0,0.1]);
Hier der Quellcode:
function point3D(startVec,stopVec,varargin)
% Input arguments:
% startVec ... input vector of the beginning of the point in [x,y,z]
% stopVec ... input vector of the ending of the point in [x,y,z]
%
% Optional input argument (varargin):
% 'Marker',sign ... defines the marker as '.' or 'arrow'
% 'LineWidth',LineWidth ... LineWidth of the vector
% 'Color',color ... define the color of the arrow/point
% 'Deviation',devVec ... defines the deviation to the point of the label
% 'Label',name ... defines the label of the point/arrow.
% 'PlotProjection' ... plot the projection from 0 to the point
if isempty(varargin)
varargin{1} = '';
end
[logic, index] = max(strcmp(varargin,'Marker'));
if logic
sign = varargin{index+1};
else
sign = '.';
end
[logic, index] = max(strcmp(varargin,'LineWidth'));
if logic
LineWidth = varargin{index+1};
else
LineWidth = 1.5;
end
[logic, index] = max(strcmp(varargin,'Color'));
if logic
color = varargin{index+1};
else
color = [0 0 0];
end
[logic, index] = max(strcmp(varargin,'Label'));
if logic
name = varargin{index+1};
else
name = '';
end
[logic, index] = max(strcmp(varargin,'Deviation'));
if logic
devVec = varargin{index+1};
dx = devVec(1);
dy = devVec(2);
dz = devVec(3);
else
dx=0;
dy=0;
dz=0;
end
x1 = startVec(1);
y1 = startVec(2);
z1 = startVec(3);
x2 = stopVec(1);
y2 = stopVec(2);
z2 = stopVec(3);
[logic, ~] = max(strcmp(varargin,'PlotProjection'));
if logic
plot3([0 x2],[y2 y2],[z2 z2],'--','Color',[0.8 0.8 0.8]);
plot3([x2 x2],[0 y2],[z2 z2],'--','Color',[0.8 0.8 0.8]);
plot3([x2 x2],[y2 y2],[0 z2],'--','Color',[0.8 0.8 0.8]);
end
if strcmp(sign,'arrow') == 1
xrange = x2-x1;
yrange = y2-y1;
zrange = z2-z1;
arrow3D([x2,y2,z2],[x2+xrange/7,y2+yrange/7,z2+zrange/7],'Length',1,'Thickness',1,'Color',color);
else
p2 = plot3(x2, y2, z2,sign,'Color',color,'Markersize',7);
end
p1 = plot3([x1 x2],[y1 y2],[z1 z2],'LineWidth',LineWidth);
p3 = text(x2+x2/10+dx, y2+y2/7+dy, z2+z2/10+dz,name);
set([p1 p3],'Color',color);
end


Anstelle der von mir genutzten Funktion colors('darkgreen') bitte einfach in RGB die Werte übergeben: [20,150,40]
AntwortenLöschen