Matlab: Fehlergeraden
Das Verfahren:
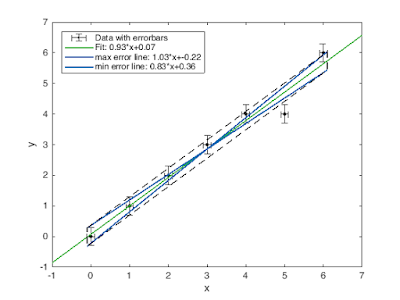
(English) Dieser Post geht über das plotten von Fehlergeraden für zum Beispiel Protokolle in der Uni oder andere Anwendungen. Die Methode dabei ist, dass durch die y-Werte mit deren Fehlern eine minimale und eine maximale Gerade geplottet wird. Diese ergeben eine Box bei welcher die x-Abgrenzung an der Stelle des ersten Messwerte mit Fehler in negative x-Richtung und den letzten Messwert mit Fehler in positive x-Richtung. Nun werden die Ecken der Box diagonal mit zwei Geraden verbunden, welche die Fehlergeraden sind.Die Funktion zeichnet mit dem Befehl "[varargout] = errlinefunc(x, y,xerr,yerr, varargin)" die Fehlergerade in blau. Farbe und weiteres kann geändert werden ('LineColor',[0.5 0.5 0]) zu Orange beispielsweise oder die Dicke der Linie mit ('LineWidth',2). Mit der Option 'Fit' wird in grün ('FitColor') der lineare Fit durch die Messwerte gezeigt. Mit Option 'Plot' werden x und y mit deren Fehlerbalken dargestellt in schwarz ('PlotColor'). Mit 'Box' wird die Mox in schwarz ('BoxColor'), gestrichelt darum gezeichnet. 'Legend' gibt die Legende aus, wobei deren Position mit 'Location','NorthEast' oder ähnliches und die Namen mit 'LegendNames',{['1','2','3']} geändert werden können.
Dieser Aufruf der Funktion plottet folgendes:
figure;hold on;box on;
errlinefunc([0;1;2;3;4;5;6],[0;1;2;3;4;4;6],0.1,0.3','Box','Plot','Fit','Legend');
Die Funktion gibt mit "smax,smin" die Steigungen der maximalen und minimalen Fehlergerade an und mit "rmax,rmin" deren Schnittpunkt mit der y-Achse. Diese können als varargout alle ausgegeben werden.
Hier kann sie runtergeladen werden: Download
Quellcode:
Der Quellcode der Funktion sieht wie folgt aus:function [varargout] = errlinefunc(x, y,xerr,yerr, varargin)
% This is a function to plot a maximal and minimal errorline with given
% errors 'xerr' and 'yerr'. Further options are:
% 'Box' ... Plots a box around min and max errorline (Default: off)
% 'BoxColor',BoxColor ... this changes the color of the box (Default: black)
% 'LineColor',LineColor ... changes color of error lines (Default: blue)
% 'LineWidth',LineWidth ... changes all line widths (Default: 1.5)
% 'Plot' ... Plots input x and y with errorbar xerr and yerr (Default: off)
% 'PlotColor',PlotColor ... changes the color of the plot (Default: black)
% 'MarkerSize',MarkerSize .... changes size of plot marker (Default: 10)
% 'Marker',Marker .... changes marker of the plot (Default: '.')
% 'Fit' ... draws the fit through x and y (Default: off)
% 'FitColor',FitColor ... colors the fit (Default: green)
% 'Legend' ... activates the legend for the chosen plot option
% 'Location',Location ... plots the legend at a certain location (Default:
% NorthWest)
% 'LegendNames',LegendNames ... is a cell array containing the names for
% the legend (Default: {['Data with errorbars','Fit','max error line','min
% error line']})
len=numel(x);
if(xerr==0)
xerr = zeros([len,1]);
end
if numel(xerr)~=len
xerr = ones([len,1]).*xerr;
end
if numel(yerr)~=len
yerr = ones([len,1]).*yerr;
end
ymax=y+yerr;
ymin=y-yerr;
fitmax=fit(x,ymax,'poly1');
fitmin=fit(x,ymin,'poly1');
fitVal=fit(x,y, 'poly1');
%Fit the maximal and the minimal errorlines through the mesured values with
%their deviations.
a=coeffvalues(fitmax);
b=coeffvalues(fitmin);
c=coeffvalues(fitVal);
amax=a(1);
amin=b(1);
bmax=a(2);
bmin=b(2);
% afit=c(1);
% bfit=c(2);
%Declare the 4 corners of the box
xlu=x(1)-xerr(1);
xld=x(1)-xerr(1);
xru=x(len)+xerr(len);
xrd=x(len)+xerr(len);
ylu=amax*xlu+bmax;
yru=amax*xru+bmax;
yld=amin*xld+bmin;
yrd=amin*xrd+bmin;
%Declare the vectors of the corners.
xcorner=[xlu xru xrd xld xlu];
ycorner=[ylu yru yrd yld ylu];
xcrnmax=[xlu xrd];
xcrnmin=[xld xru];
ycrnmax=[ylu yrd];
ycrnmin=[yld yru];
smax=(yru-yld)/(xru-xld);
smin=(yrd-ylu)/(xrd-xlu);
rmax=yld-xld*smax;
rmin=ylu-xlu*smin;
% f1(x)=rmax+x*smax;
% f2(x)=rmin+x*smin;
%Declare the rises and the y-values
% s1=(yrd-ylu)/(xrd-xlu);
% s2=(yru-yld)/(xru-xld);
% y1=ylu-s1*xlu;
% y2=yld-s2*xld;
yneg = yerr;ypos = yerr;
xneg = xerr;xpos = xerr;
% output the slope s and the x axis cut t from f(x)=r+x*s; where max
% describes the upper errorline
varargout{1} = smax;
varargout{2} = smin;
varargout{3} = rmax;
varargout{4} = rmin;
if max(strcmp(varargin,'LineWidth'))
idx = 1 + find(strcmp(varargin,'LineWidth'));
LineWidth = varargin{1,idx};
else
LineWidth = 1.5;
end
hold on;
legCount = 1;
myLegend = gobjects(1,1);
myLegNames{1,legCount} = cell(1,1);
% depicts mimal and maximal error line
if max(strcmp(varargin,'LineColor'))
idx = 1 + find(strcmp(varargin,'LineColor'));
LineColor = varargin{1,idx};
else
LineColor = [0 0.4 0.7];
end
% show the plot with errorbars
if max(strcmp(varargin,'Plot'))
if max(strcmp(varargin,'Marker'))
idx = 1 + find(strcmp(varargin,'Marker'));
Marker = varargin{1,idx};
else
Marker = '.';
end
if max(strcmp(varargin,'MarkerSize'))
idx = 1 + find(strcmp(varargin,'MarkerSize'));
MarkerSize = varargin{1,idx};
else
MarkerSize = 10;
end
if max(strcmp(varargin,'PlotColor'))
idx = 1 + find(strcmp(varargin,'PlotColor'));
PlotColor = varargin{1,idx};
else
PlotColor = [0 0 0];
end
hError = errorbar(x,y,yneg,ypos,xneg,xpos,'.','Color',PlotColor,...
'LineWidth',LineWidth*0.7);
plot(x,y,Marker,'Color',PlotColor,...
'LineWidth',LineWidth,'MarkerSize',MarkerSize);
myLegend(legCount) = hError;
myLegNames{1,legCount} = 'Data with errorbars';
legCount = legCount + 1;
end
% draw the fit through x and y
if max(strcmp(varargin,'Fit'))
if max(strcmp(varargin,'FitColor'))
idx = 1 + find(strcmp(varargin,'FitColor'));
FitColor = varargin{1,idx};
else
FitColor = [0.2 0.7 0.2];
end
hFit = plot(fitVal);
set(hFit,'LineWidth',LineWidth','Color',FitColor);
myLegend(1,legCount) = hFit;
myLegNames{1,legCount} = ['Fit: ',num2str(round(c(1),2)),'*x+',...
num2str(round(c(2),2))];
legCount = legCount + 1;
end
hErrLineMax = line(xcrnmax,ycrnmax,'Color',LineColor,'LineWidth',LineWidth);
hErrLineMin = line(xcrnmin,ycrnmin,'Color',LineColor,'LineWidth',LineWidth);
myLegend(legCount) = hErrLineMax;
myLegNames{1,legCount} = ['max error line: ',num2str(round(smax,2)),'*x+',...
num2str(round(rmax,2))];
legCount = legCount + 1;
myLegend(legCount) = hErrLineMin;
myLegNames{1,legCount} = ['min error line: ',num2str(round(smin,2)),'*x+',...
num2str(round(rmin,2))];
% depict the box of the errorlines
if max(strcmp(varargin,'Box'))
if max(strcmp(varargin,'BoxColor'))
idx = 1 + find(strcmp(varargin,'BoxColor'));
BoxColor = varargin{1,idx};
else
BoxColor = [0 0 0];
end
plot(xcorner,ycorner,'--','Color',BoxColor,'LineWidth',LineWidth*0.7);
end
% add a legend
if max(strcmp(varargin,'Legend'))
if max(strcmp(varargin,'Location'))
idx = 1 + find(strcmp(varargin,'Location'));
Location = varargin{1,idx};
else
Location = 'NorthWest';
end
if max(strcmp(varargin,'LegendNames'))
idx = 1 + find(strcmp(varargin,'LegendNames'));
LegendNames = varargin{1,idx};
else
LegendNames = myLegNames;
end
legend(myLegend,LegendNames,'Location',Location);
end
end


Kommentare
Kommentar veröffentlichen